Hello,
This is about correlation analysis among factors.
The correlation analysis used to lots of study area.
In my case, microbiome and enviornmental factors are analyzed by correlation methods.
"Hmisc" package is used in RStudio.
Let's follow the below steps to analysis.
1. Install packages
install.packages("Hmisc")
install.packages("xlsx")
2. Run packages
library(Hmisc)
library(xlsx)
3. Set calculate matrix
flattenCorrMatrix <- function(cormat, pmat) {
ut <- upper.tri(cormat)
data.frame(
row = rownames(cormat)[row(cormat)[ut]],
column = rownames(cormat)[col(cormat)[ut]],
cor =(cormat)[ut],
p = pmat[ut]
)
}
4. Input dataframe
test <- read.delim("clipboard", row.names=1) # Copy and paste your data from excel
test <- t(test)
5. Calculate Correlation
rcorr1<-rcorr(as.matrix(test), type=c("spearman"))
datacorS1 <- flattenCorrMatrix(rcorr1$r, rcorr1$P)
datacorS1$p_BH = p.adjust(datacorS1$p, method = "BH")
datacorS1$ABS = abs(datacorS1$cor)
datacorS2 <- subset(datacorS1, p_BH<0.0001)
datacorS3 <- subset(datacorS2, ABS>0.8)
Here you can change method with spearman to pearson.
These are different calculating equations each other.
Simply, spearman is rank-based on value.
So, highest value will be number 1 and following are 2, 3 ,4... etc.
In the other hands, raw value will be used in pearson method.
Finally, you can understand is it normalized (spearman) or not (pearson).
6. Make Output file
write.xlsx2(datacorS3, "E:/test.xlsx", sheetName = "Sheet1", col.name = T, row.names = F, append = F)

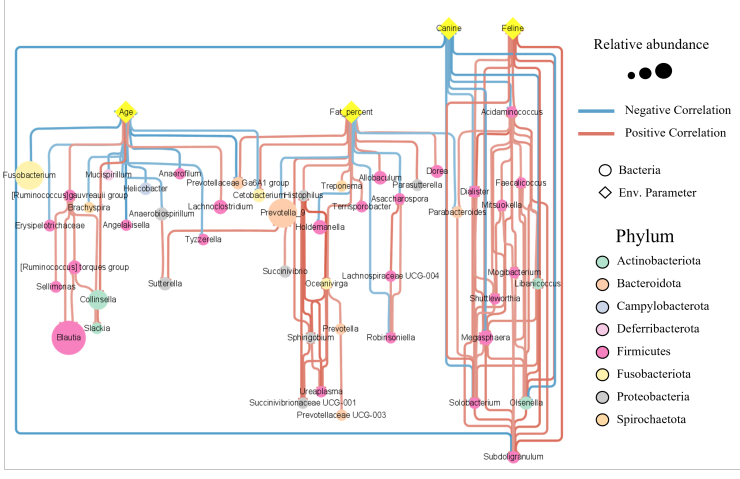
Supplementary story)

'R > R_Usage [Eng.]' 카테고리의 다른 글
| Tax4Fun2 Analysis Tutorial in Rstudio [16S Functional Prediction] (0) | 2022.11.28 |
|---|---|
| Correlation Plot Visualization "Corrplot" with Rstudio. (1) | 2022.11.15 |
| Heatmap visualization in Rstudio _ high resoultion figure (0) | 2022.11.08 |
| ANOSIM, Statistical analysis with Rstudio (0) | 2022.11.07 |
| Rstudio_ working directory default setting (0) | 2022.11.07 |