안녕하세요,
두 가지 팩터에 대한 상관 관계 분석에 대한 포스팅이에요.
상관 관계 분석은 다양한 분야에 이용되곤 하는데요,
저는 주로 마이크로바이옴의 박테리아와 다른 환경인자 사이에서 분석을 하곤 합니다.
RStudio의 이용 패키지는 "corrplot" 이랑 "PerformanceAnalytics" 에요.
다음 스텝에 따라 없어도 있어 보이는 시각화 그림을 만들어 보세요.
1. 패키지 설치
#+++++++++++++++++++++++++Install Packages++++++++++++++++++++++++++++++++++++#
install.packages("corrplot")
install.packages("PerformanceAnalytics")
2. 패키지 실행
#++++++++++++++++++++++++++Load library+++++++++++++++++++++++++++++++++++++++#
library(corrplot)
library(PerformanceAnalytics)
3. 파일 불러오기
#++++++++++++++++++++++++++Input data+++++++++++++++++++++++++++++++++++++++++#
test <- read.delim("clipboard", row.names=1) #엑셀에서 input format Ctrl+C
test <- t(test)
read.delim은 "clipboard" 한 것을 불러오는 명령어에요.
아래 엑셀과 같은 파일 포맷을 불러왔어요.
t()의 명령어는 행열을 전환하는 명령어에요.
처음부터 데이터 포맷을 두 번째 사진과 같이 불러오면, 행열 전환 명령어는 필요 없어요.


4. 상관 관계 계산
#+++++++++++++++++++++++++++ Calculate ++++++++++++++++++++++++++++++++++#
Correlation <- cor(test, use="pairwise.complete.obs", method = "spearman")
계산 방법에는 method = 는 pearson 또는 spearman 또는 그 외 다른 방법으로도 가능해요.
5. 시각화 (4가지 방법)
#++++++++++++++++++++++++++++ Plot 1 ++++++++++++++++++++++++++++++++++++++#
corrplot(Correlation)

#++++++++++++++++++++++++++++ Plot 2 ++++++++++++++++++++++++++++++++++++++#
corrplot(Correlation, method = "square", type = "upper",tl.col = "black", tl.cex = 0.7,col = colorRampPalette(c("blue", "red"))(200))

#++++++++++++++++++++++++++++ Plot 3 ++++++++++++++++++++++++++++++++++++++#
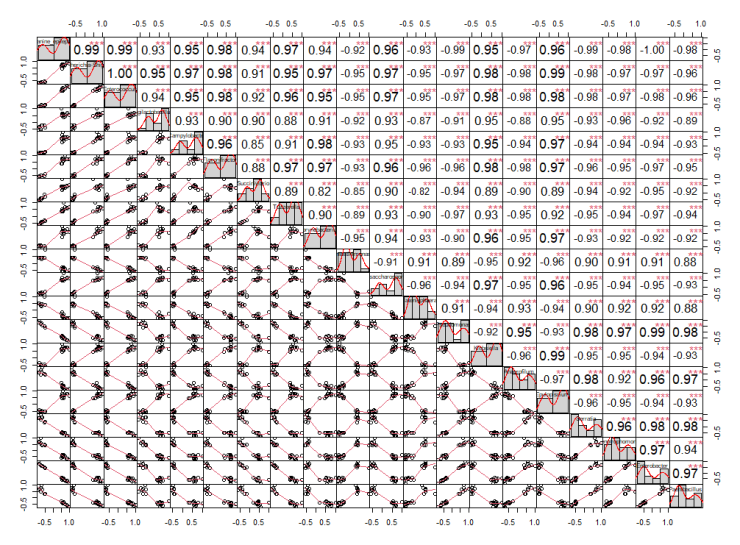
corrplot.mixed(Correlation, upper = "square", lower = "number", addgrid.col = "black", tl.col = "black", tl.cex = 0.55)

#++++++++++++++++++++++++++++ Plot 4 ++++++++++++++++++++++++++++++++++++++#
chart.Correlation(Correlation)
6. 시각화 자료 불러오기
#+++++++++++++++++++++++++++++ Set working directory +++++++++++++++++++++++++#
getwd()
setwd("F:/SRA/Output_Figure/Corplot")
getwd()
현재 내가 어디 폴더에서 작업하는지 확인하고, 작업 폴더를 세팅하는 방법이에요.
#+++++++++++++++++++++++++++++ Get output figure ++++++++++++++++++++++++++++++#
tiff(file="corplot_canine_fat_percent.tiff", width = 10, height = 6, units = "in", res = 600)
corrplot.mixed(Correlation, upper = "square", lower = "number", addgrid.col = "black", tl.col = "black", tl.cex = 0.55)
dev.off()
'R > R_Usage [KOR.]' 카테고리의 다른 글
| R을 이용한 미생물군집 기능분석 [Tax4Fun2] (2) | 2022.11.22 |
|---|---|
| R을 이용한 Correlation 분석 (0) | 2022.11.15 |
| R을 이용한 Heatmap 시각화 (0) | 2022.11.08 |
| Rstudio의 working directory 디폴트 설정 (0) | 2022.11.07 |
| R 언어 header 의미와 column 이름 지정 (0) | 2022.11.03 |